News and Analytics
Portugal
Portugal Citizenship Law Published: What Investors Need to KnowThe President of Portugal promulgated the new citizenship law and signed the decree on May 3rd, 2026\[1\]. Lei...

Portugal
Portugal Residence Permits Go Online: What Applicants Need to KnowPortugal has simplified the procedure for submitting and certifying documents for residence permits. Pedro Barata,...

Mauritius
Mauritius Launches a Fast-Track Golden Visa with Approval in 5 DaysMauritius will issue residence permits to investors who want to move to the country quickly. Elena Ruda, Co-Founder...

UAE
Dubai residence made easier for property ownersThe UAE no longer has a minimum investment threshold for obtaining a residence visa. Zlata Erlach, head of the...

São Tomé & Príncipe
São Tomé and Príncipe Simplifies Citizenship Process for InvestorsThe São Tomé and Príncipe Citizenship Investment Unit has approved a new process. Lyle Julien, investment programmes...

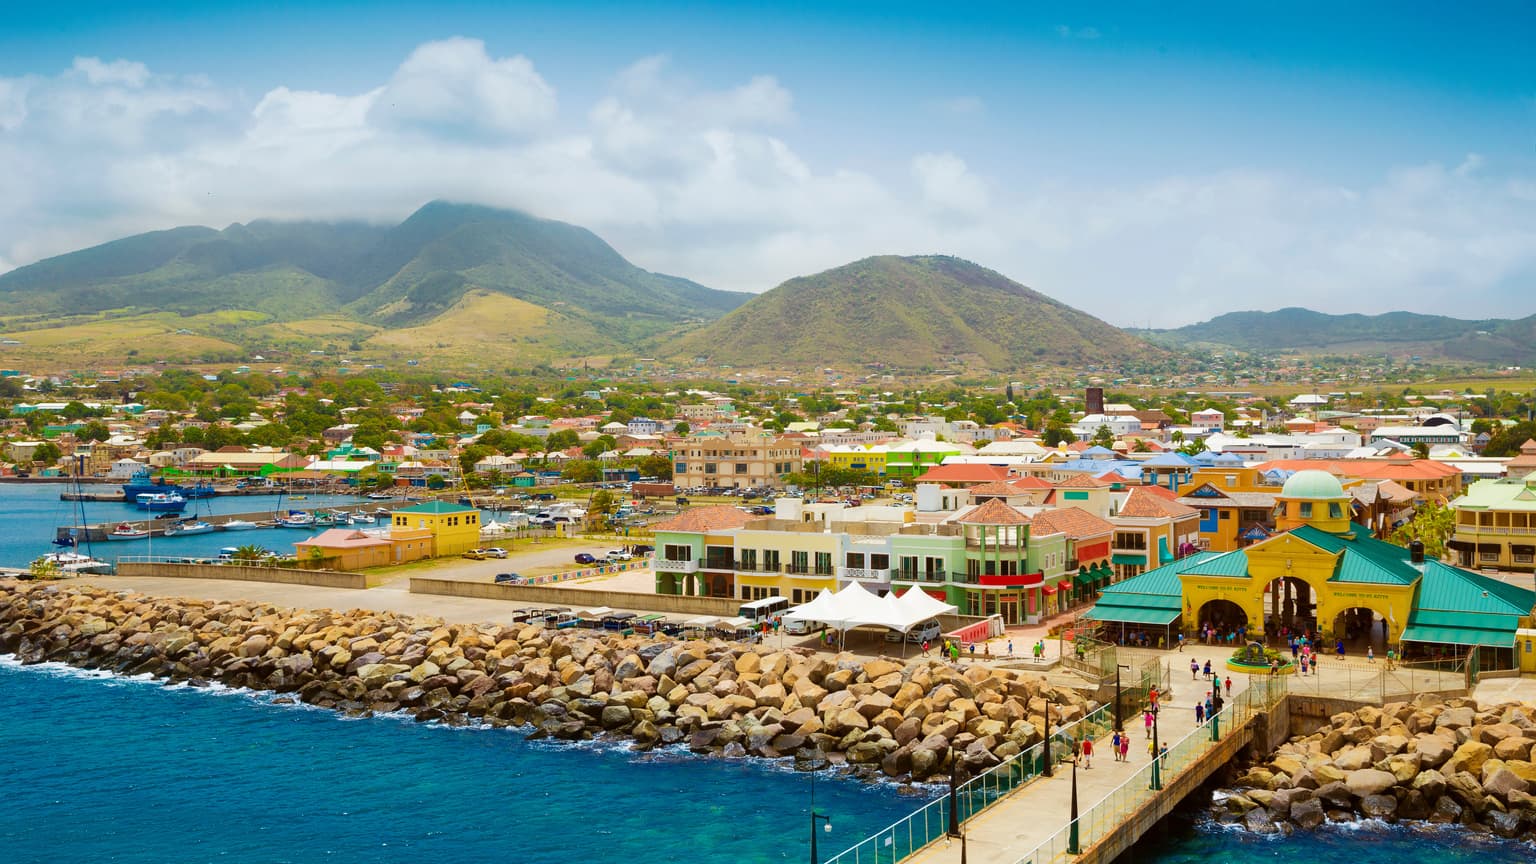
St Kitts & Nevis
Biometrics for St Kitts and Nevis citizenship are now accepted in IstanbulThe Citizenship by Investment Unit of St Kitts and Nevis has confirmed that applicants can submit their biometric...

Portugal
Lisbon and Porto ranked among the top 10 European cities for digital nomadsLisbon and Porto ranked among the top 10 best European cities for digital nomads in 2026. Pedro Barata, Senior...

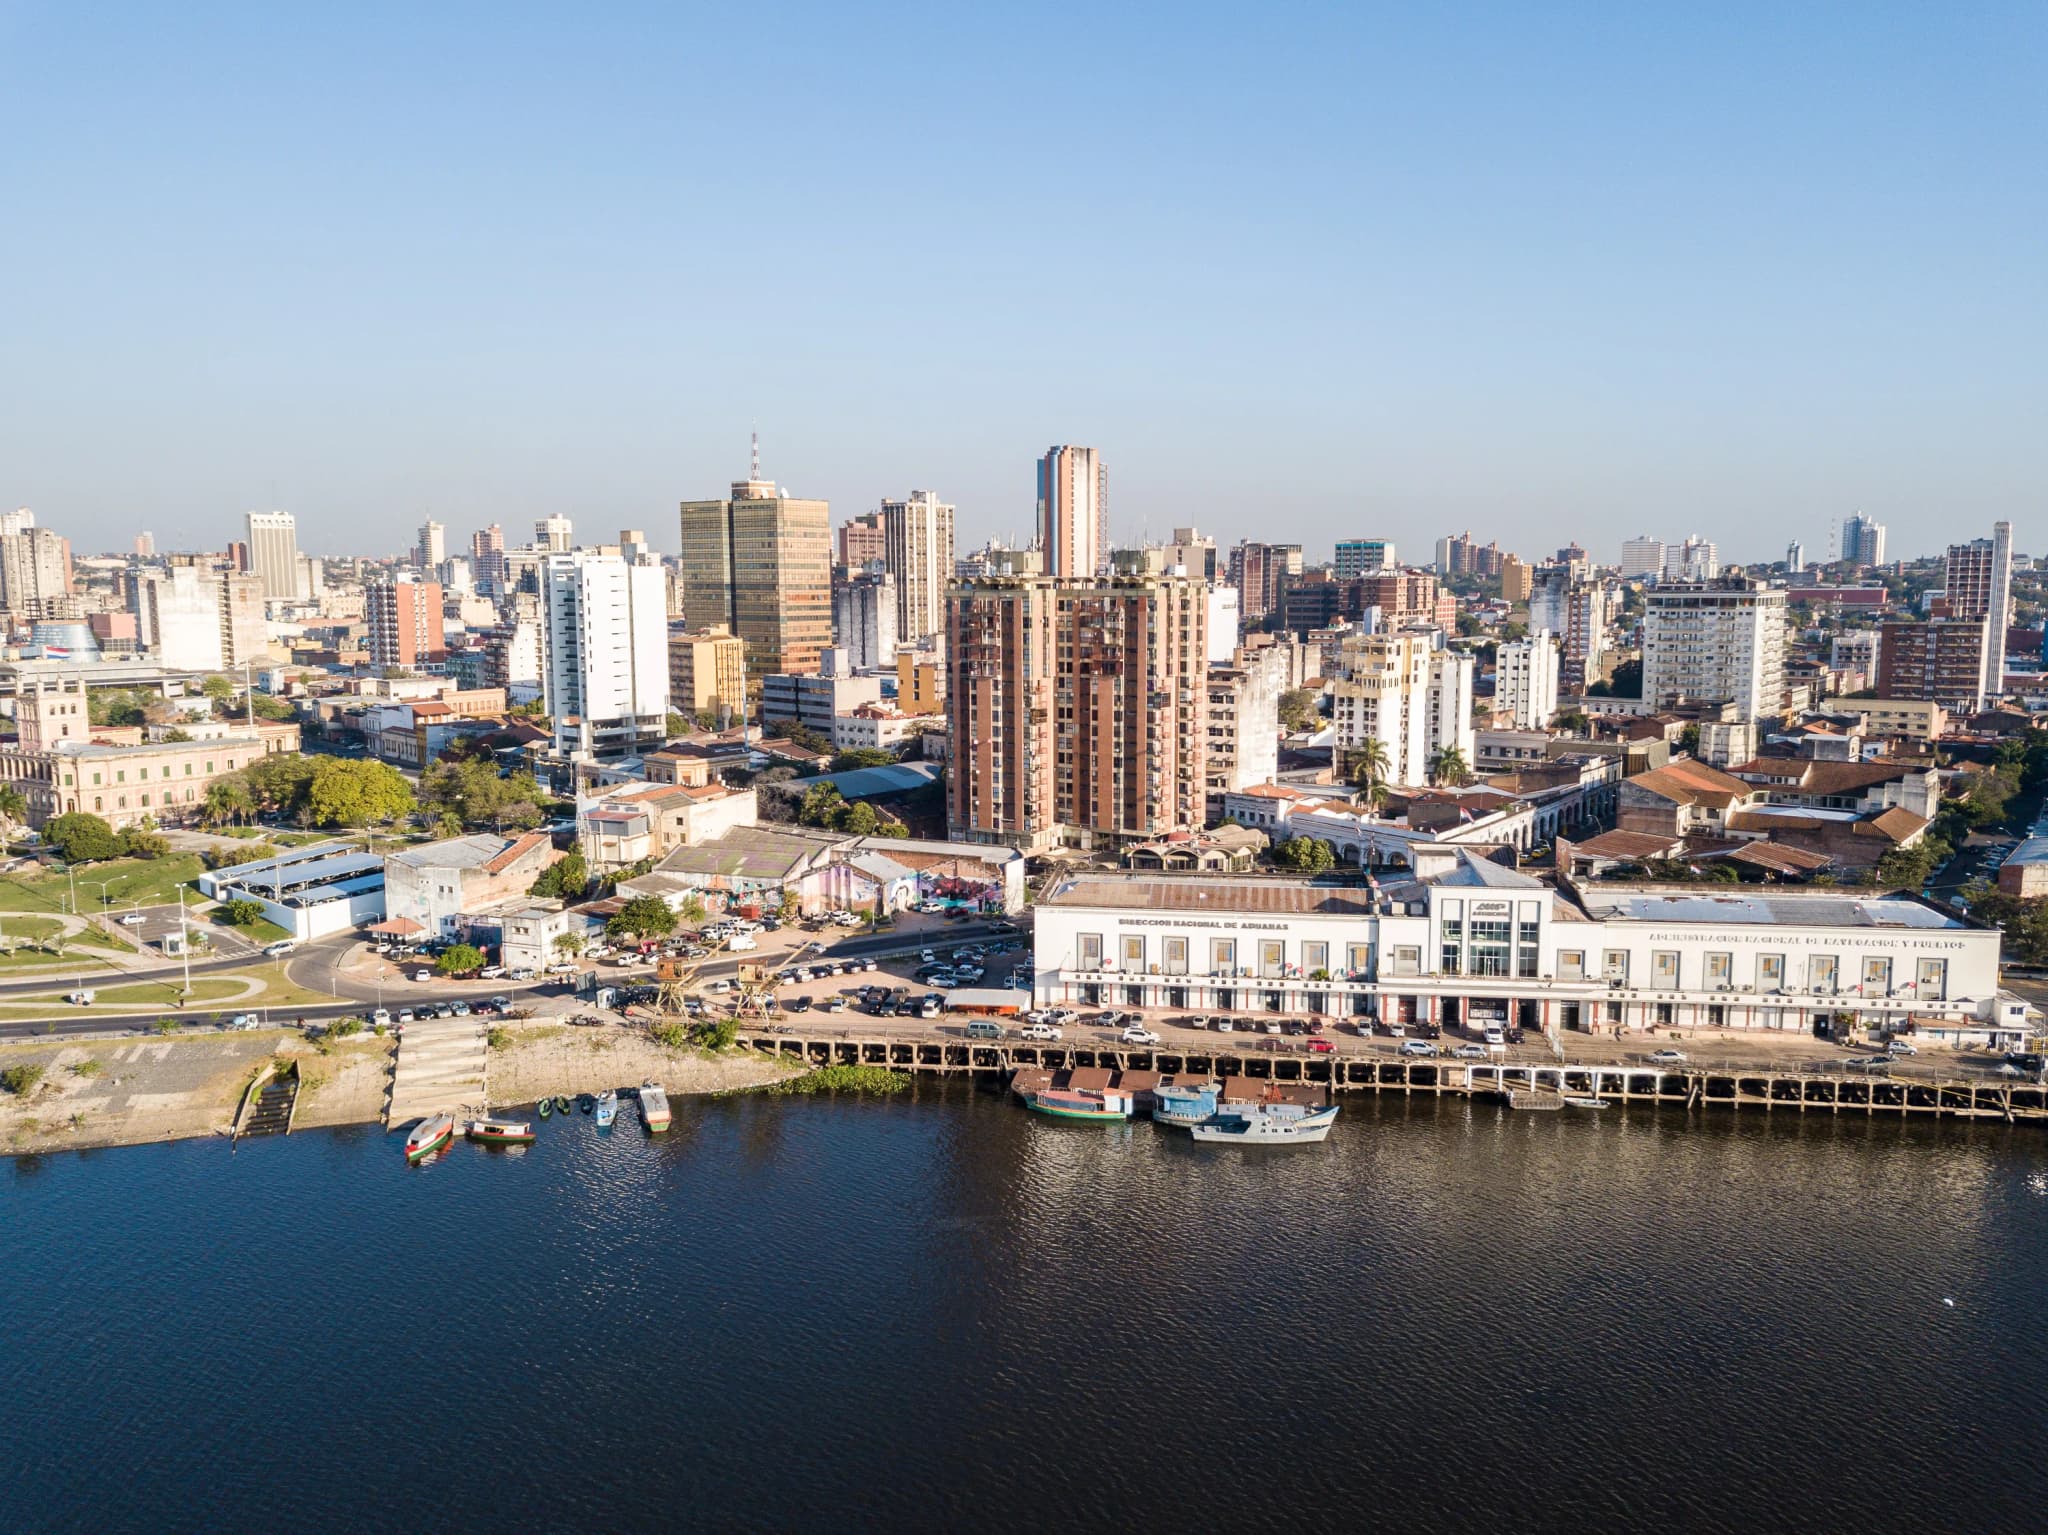
Paraguay
New fast-track pathway to Paraguay permanent residence for investorsThe Government of Paraguay has updated the rules for investment residence under the Investor Pass programme...
St Lucia
Number of applications for St Lucia citizenship increased by 424%St Lucia has published an annual report on the performance of its citizenship by investment programme in...

Portugal
Portugal Golden Visa Sees 300% Rise in Cultural InvestmentInvestment in Portugal’s cultural projects that allow applicants to qualify for the Golden Visa has grown sharply...

St Kitts & Nevis
Investors Have 15 Months to Upgrade St Kitts and Nevis PassportsSt Kitts and Nevis officially launched a national biometric registration programme for citizens on April 15th,...
São Tomé & Príncipe
São Tomé and Príncipe Reforms Citizenship by Investment ProgrammeSão Tomé and Príncipe clarified the rules of its citizenship by investment programme in a memorandum dated April...

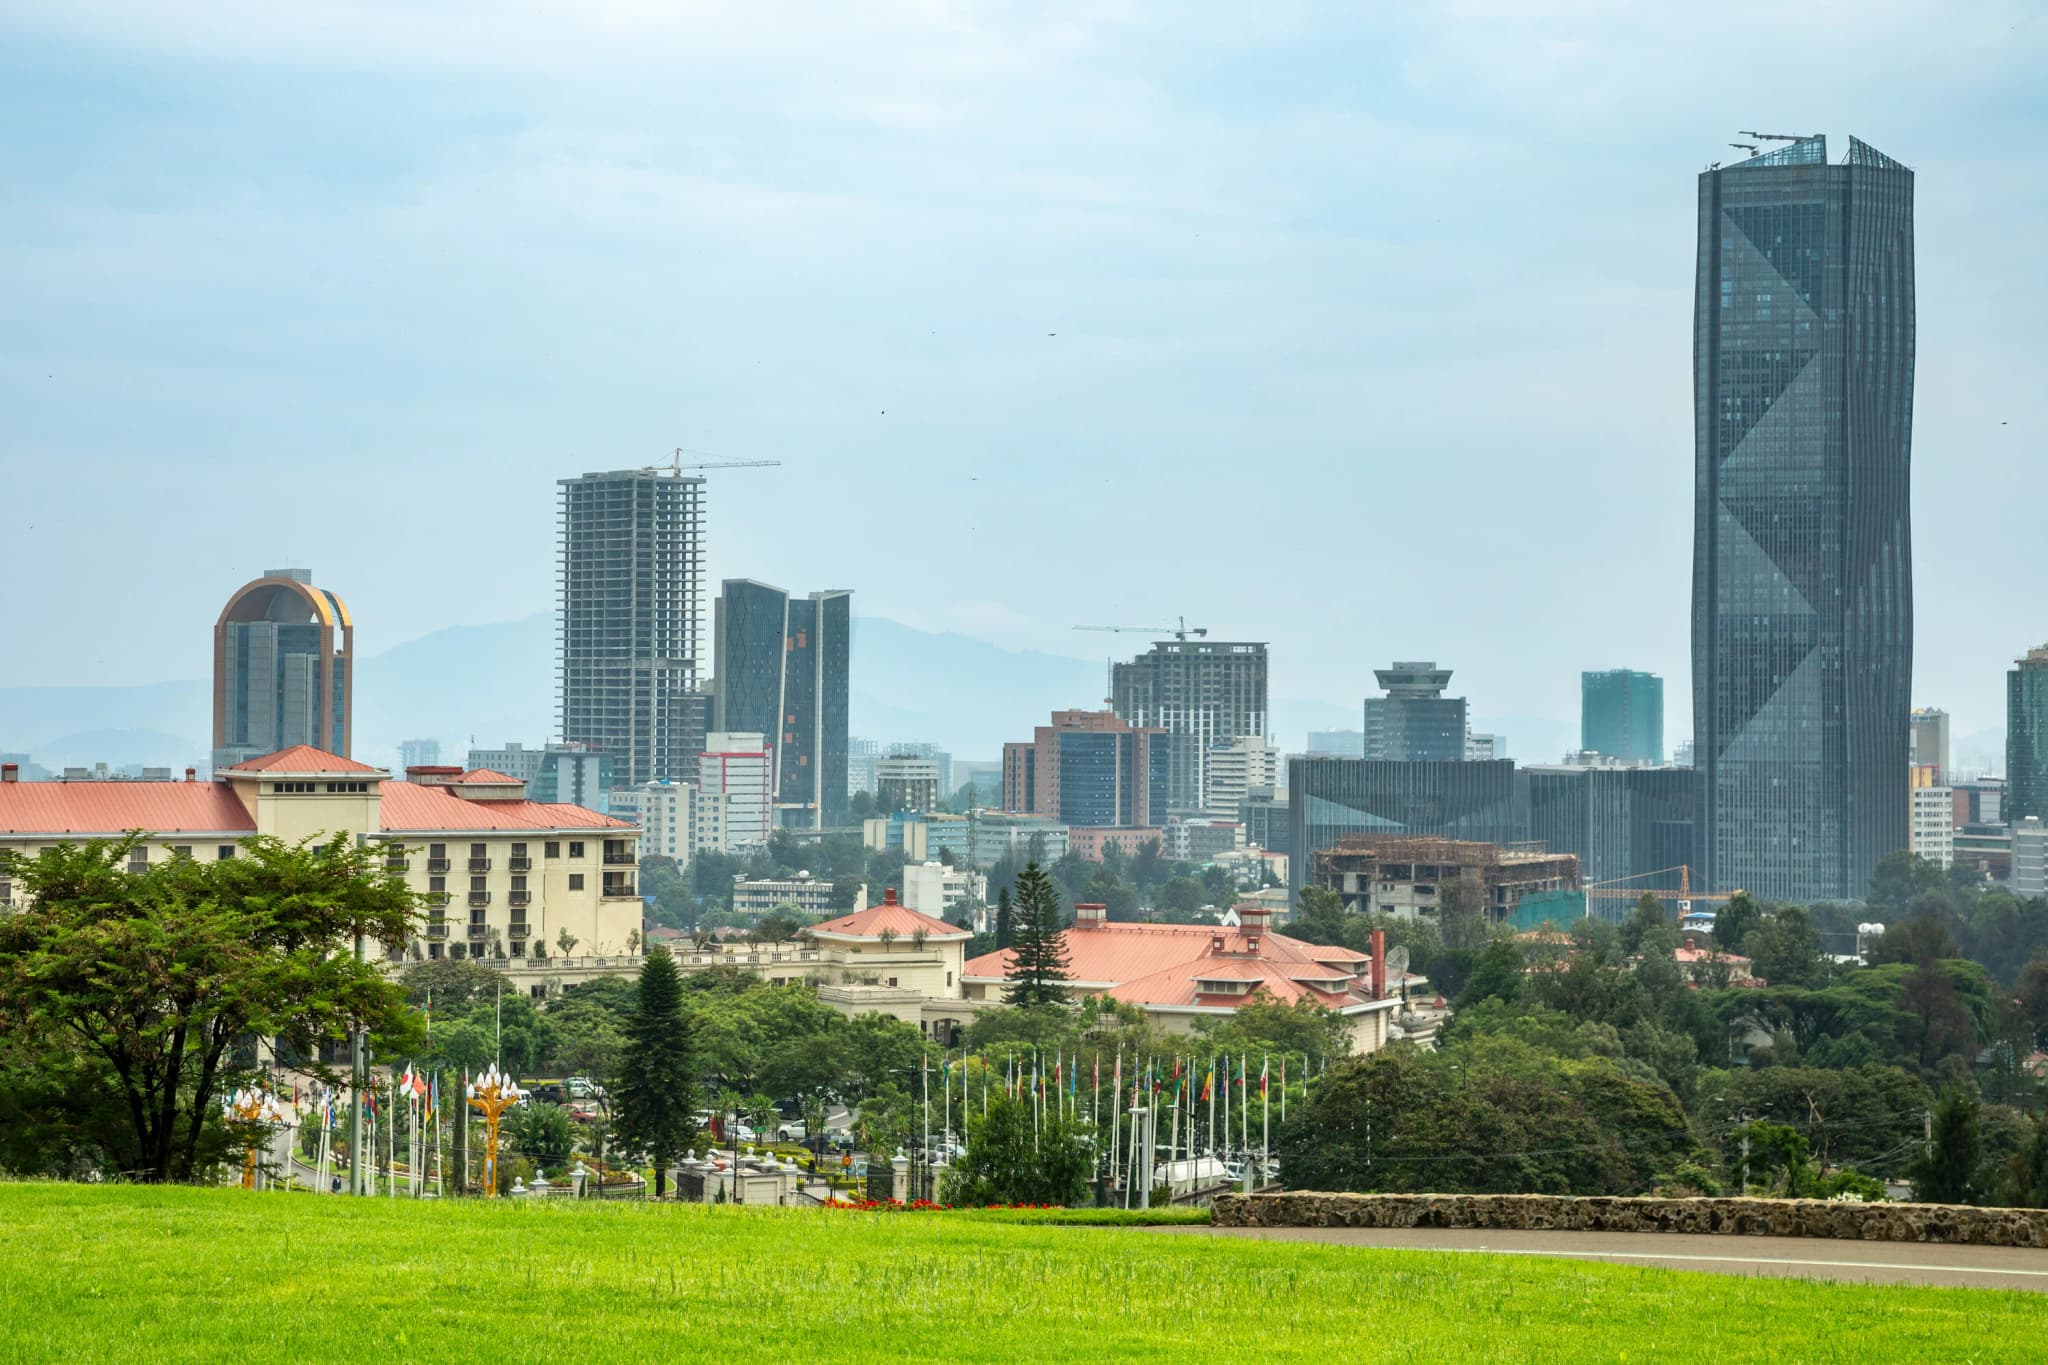
Ethiopia
Ethiopia Launches a Golden Visa and Opens its Housing Market to ForeignersEthiopia is launching a Golden Visa for foreign investors, with an opportunity to obtain long-term residence in the...
Cyprus
1.2 Million People Obtained EU Citizenship: Where Passports Are Granted Most OftenEurostat has published new data on citizenship granted to foreigners in 2024. Vladlena Baranova, head of Legal &...

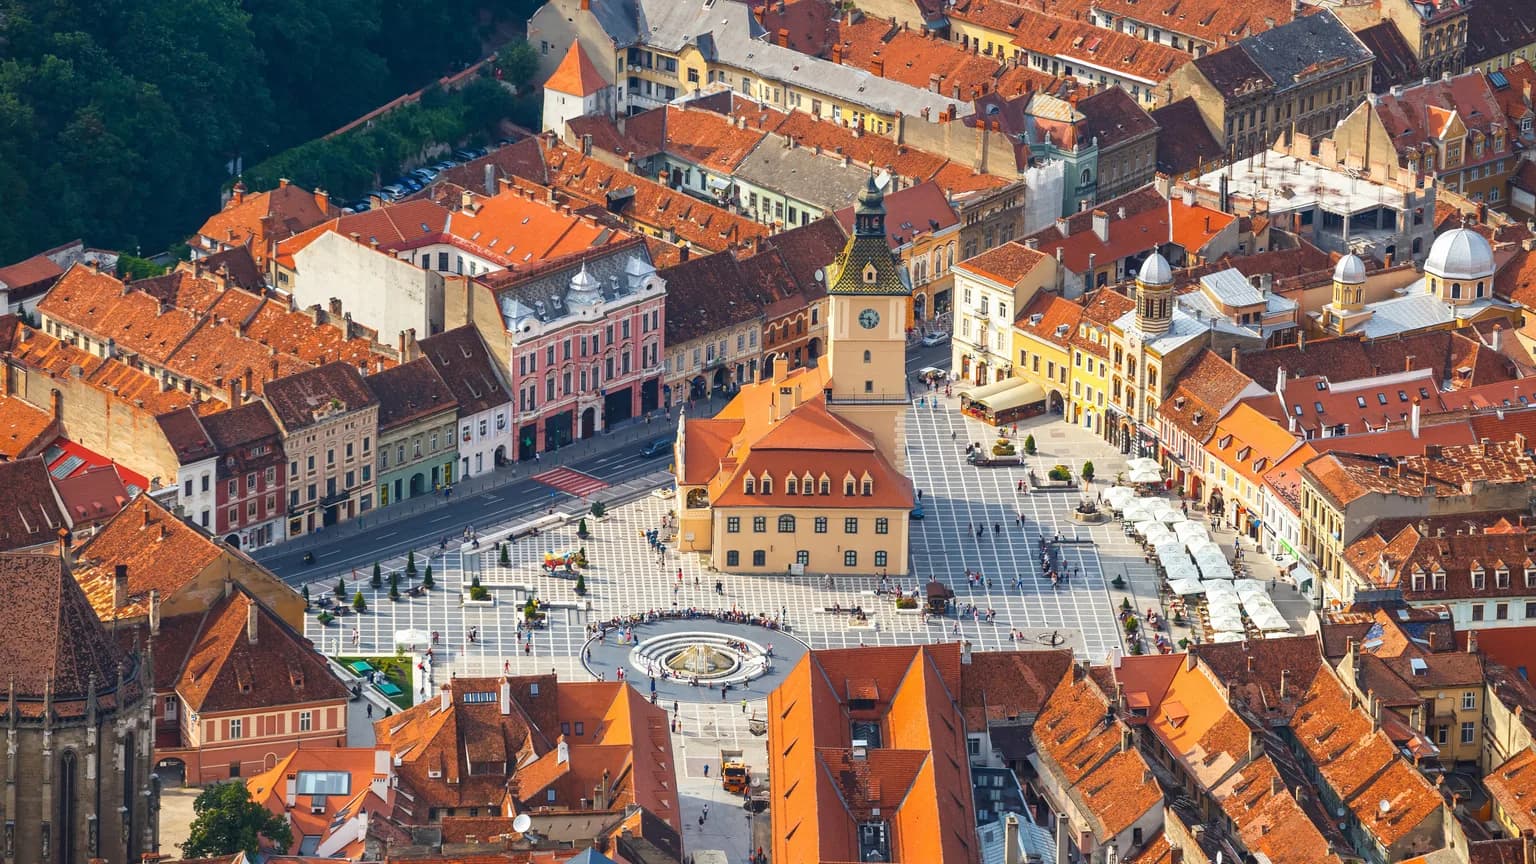
Portugal
Portugal's New Nationality Law: 7- and 10-Year Routes Under Lei Orgânica 1/2026On 18 May 2026, Lei Orgânica n.º 1/2026 — Portugal's new Nationality Law — was published in Diário da República n.º...

Turkey
Fast-Track Procedure for Investors in TürkiyeTürkiye offers investors a fast-track VIP procedure under the citizenship by investment programme. Vladlena...

Portugal
Portugal's Citizenship Law: Lei Organica 1/2026 in Force from 19 May 2026Eymi Castro, an immigration expert with Immigrant Invest, walks through how Portugal's nationality law reached its...

St Kitts & Nevis
Biometrics and Mandatory Residence in St Kitts and Nevis: Latest News of the CBI ReformSt Kitts and Nevis held its first meeting of 2026 between the CIU and authorised agents. Avril Blanchett, Investment...

St Kitts & Nevis
St Kitts and Nevis Launch a New Biometric System for InvestorsThe St Kitts and Nevis Government has announced the launch of a new biometric passport system for investors starting...
St Kitts & Nevis
US Lifts FinCEN Advisory on St Kitts and Nevis Citizenship by InvestmentThe St Kitts and Nevis Citizenship Unit has confirmed that the US Financial Crimes Enforcement Network, FinCEN,...

Qatar
Qatar’s New Golden Visa: Who Qualifies for a 10-Year Permit?Qatar announced the launch of two new residence visa categories. These residence permits are valid for up to 10...

Andorra
Andorra Raised Investment Threshold for Residency to €1 MillionOn January 22nd, 2026, the Andorran Parliament approved the Omnibus 2 Law that changed the procedure for obtaining...

Portugal
Portuguese Residence Permits Can Now Be Renewed Online. Here Is HowA Portuguese residence permit obtained by investment can now be renewed without visiting the AIMA agency. The...

Spain
Spain Updates Income Requirements for the Digital Nomad Visa in 2026An increase in the minimum wage in Spain changes the income thresholds for digital nomad visa applicants. Amy...

5 Changes in São Tomé and Príncipe Investors Should Know About
In January 2026, São Tomé and Príncipe introduced new rules for applicants seeking a passport by investment. The...

United States
USA Imposes Visa and Entry Ban on Citizens of 38 Countries, Including Two Caribbean StatesThe United States has announced visa and entry restrictions for citizens of 38 countries, including Antigua and...

Grenada
Grenada CBI Update: Key Rule Changes Coming in 2026Grenada has announced upcoming changes to its citizenship by investment program. Investors and their families will...

United States
US to End Dual Citizenship: Can Americans Still Hold Two Passports?US Senator Bernie Moreno introduced a radical new bill that could force millions of Americans to choose between...

Portugal
Portugal Citizenship Reform: Insights from Immigrant Invest LawyersPortugal's Lei Organica n.o 1/2026 was published in Diario da Republica n.o 95/2026, Serie I on 18 May 2026 and...

Portugal
Portugal and Other EU Countries Tighten Their Citizenship RulesPortugal approved amendments to its citizenship law on October, 28th, 2025. The law increases the naturalisation...

Romania
Romania to Launch Golden Visa Offering 5-Year EU ResidencyRomania is set to launch a Golden Visa program, creating a new pathway to residency in the European Union through...
Greece
3 Key Trends in Greece’s Property Market: What Investors Should KnowAnnual property price growth in Greece slowed to 7.3% in the second quarter of 2025. This is the lowest figure in...

St Kitts & Nevis
St Kitts and Nevis Introduces New Rules for Citizenship by InvestmentSt Kitts and Nevis is updating its citizenship by investment program. Investors will be able to include children up...

Portugal
Historic Update: UK and Portugal Sign New Tax TreatyPortugal and the UK have updated their double taxation treaty for the first time since Brexit. The agreement aims to...

St Kitts & Nevis
How to Obtain St Kitts and Nevis Citizenship in 4 Months with No Government FeesSt Kitts and Nevis has temporarily exempted investors contributing to social projects from paying government...

São Tomé & Príncipe
São Tomé and Príncipe Launches $90,000 Citizenship ProgramSão Tomé and Príncipe has launched a citizenship by investment program, opening a new $90,000 route to second...

St Kitts & Nevis
How Families with Children Can Save $11,000 on Second CitizenshipSt Kitts and Nevis has launched a temporary offer for investors. The reduced fees apply to children under 3 who were...

Malta
5 Changes Making Malta’s Permanent Residence Programme More Appealing in 2025Malta has introduced notable changes to its Permanent Residence Programme, effective for applications submitted on...

Vietnam
Vietnam Approves Dual Citizenship. but Not for AllVietnam has approved amendments to its nationality law, allowing both Vietnamese citizens living abroad and...

Slovenia
Slovenia to Welcome Digital Nomads: Who Can Apply for the New Visa?Starting from November 2025, remote workers from around the world will be able to move to one of the EU’s most...

Ukraine
Ukraine Allows Multiple Citizenship: Who Will Be Able to Get a Second PassportUkraine's Parliament has passed a law allowing multiple citizenship. Now Ukrainians can keep passports from other...

Portugal
Portugal Said “yes” 4,987 Times: New Golden Visa StatisticsPortugal Golden Visa reaches new heights: 4,987 applications approved in 2024. The figure surpasses the previous...

United States
Protests Spread Across the US: Should Americans Look Abroad?Immigration raids in California spark nationwide protests as the President sends in troops. The unrest prompts some...

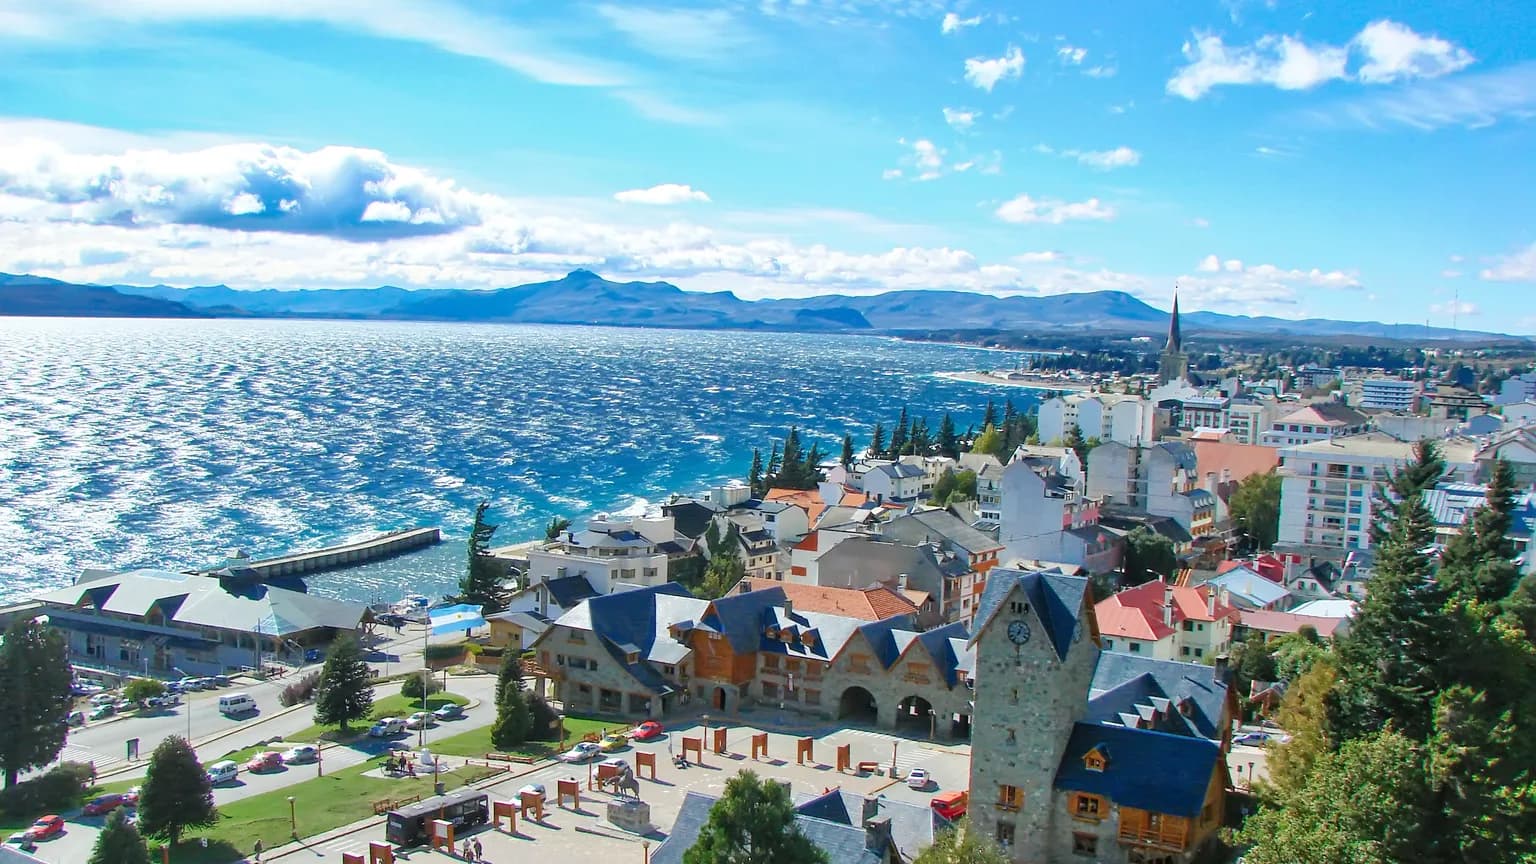
Argentina
Argentina Launches Citizenship by Investment: Entry Point Is $500,000Argentina will soon offer citizenship in exchange for investments starting at $500,000. The program is aimed at...
United States
About 5,000 Americans Renounced Citizenship in a Year: What’s Driving the Trend?The United States is facing an unprecedented spike in citizenship renunciations. In the third quarter of 2024 alone,...

Malaysia
New Malaysia Investor Pass Visa: A Simplified Path to InvestmentMalaysia has introduced a new visa to attract investors. The Investor Pass streamlines the process of visiting the...

St Lucia
Upcoming Changes to St Lucia Citizenship: Quotas and Net Worth RequirementsGetting a St Lucian passport will soon become more difficult. The government plans to bring back annual quotas, as...

Kazakhstan
New Digital Nomad Visa: How IT Professionals Can Relocate to KazakhstanIT specialists from around the world can now obtain a permanent residence permit in Kazakhstan under a simplified...

Follow us on LinkedIn
To be the first to read verified news and insights into investment migration field

Follow us on LinkedIn
To be the first to read verified news and insights into investment migration field